Latest Data
| Close | 189,84 |
|---|---|
| Date | 2024-05-16 |
| High | 191,10 |
| Low | 189,66 |
| Open | 190,47 |
| Volume | 52.800.800,00 |
52-Week High/Low
| High 52 | 2023-12-14 - 199,62 |
|---|---|
| Low 52 | 2024-04-19 - 164,08 |
| Recent High | 191,10 |
| Recent Low | 189,66 |
SMA
| 20 | 177,16 |
|---|---|
| 50 | 173,69 |
| 200 | 180,79 |
| Volume 20 | 64.965.770,00 |
Pivo Points
| R3 | 192,18 |
|---|---|
| R2 | 191,64 |
| R1 | 190,74 |
| LastClose | 189,84 |
| S1 | 189,30 |
| S2 | 188,76 |
| S3 | 187,86 |
Stock Analysis for AAPL
Overview
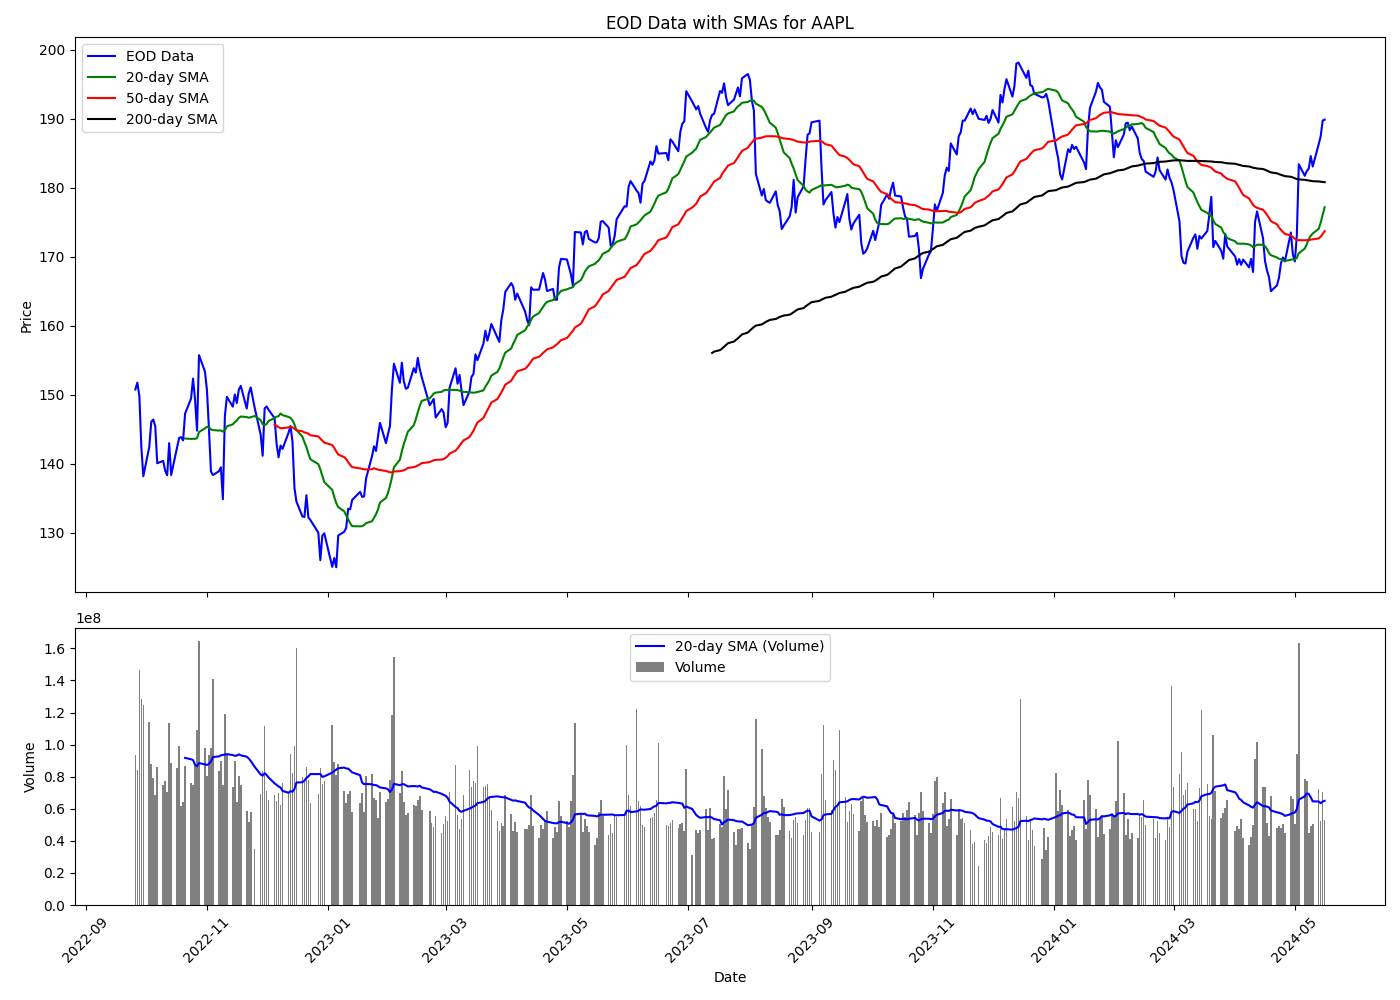
The stock chart provided is for Apple Inc. (AAPL). The chart includes data from approximately September 2022 to May 2024. It features the stock's end-of-day (EOD) price data alongside the 20-day, 50-day, and 200-day Simple Moving Averages (SMAs), as well as volume data corresponding to the same period with a 20-day SMA on volume.
Price Action and Trends
The blue line represents the EOD data, illustrating the price action of the AAPL stock. Here's a detailed analysis of the trends observed on the chart:
- Initial Decline (Sep 2022 - Jan 2023): The stock price demonstrates a declining trend, moving from around $160 to nearly $130. The green 20-day SMA and red 50-day SMA also followed a downward trend during this period.
- Uptrend (Jan 2023 - Aug 2023): There is a significant recovery and upward trend in the stock price, which increased from around $130 to above $190. Both the 20-day and 50-day SMAs turned upward, indicating positive momentum.
- Correction and Consolidation (Aug 2023 - Jan 2024): The stock price experienced volatility and mild correction with a consolidation pattern around the $160-$180 range. During this time, the 20-day and 50-day SMAs showed some oscillations without any clear trend.
- Recent Recovery (Jan 2024 - May 2024): The stock price started recovering from the correction phase, as seen from the latest upward movement of the price action, 20-day, and 50-day SMAs.
Volume Analysis
The lower part of the chart presents the trade volume data as vertical grey bars along with the 20-day SMA on volume shown in blue.
- The volume trends indicate periods of high activity corresponding to significant price actions.
- There were heightened volumes observed during the initial decline and subsequent recovery period, suggesting strong participation from traders during these crucial phases.
- Volume activity seemed to stabilize during the consolidation phase.
Potential Future Movements
Based on the current trends and moving average alignments:
- The recent recovery and upward push suggest a potential continuation of the uptrend if the price can maintain above the key moving averages, particularly the 50-day SMA.
- Watch for resistance levels around the recent highs ($190-$200). A strong break above this level with increased volume could signal a robust bullish phase.
- If the price action falls below the 50-day SMA again, it could indicate potential weakness and a possible retest of the lower support levels around $160-$170.
Conclusion
The AAPL stock has demonstrated strong recovery patterns post its corrective phase and currently shows a bullish tendency backed by the upward movement of the 20-day and 50-day SMAs. Observing key resistance and support levels along with volume activity will be crucial for making further trading decisions.